
Amazon Bedrock Cost Tracking: A Practical Setup Guide
Amazon Bedrock Cost Tracking: A Practical Setup Guide

Enable IAM principal–based cost allocation in Amazon Bedrock, activate IAM principal tags in the AWS Billing console, and include caller identity in your CUR 2.0 export. Those three steps deliver per-user and per-role Bedrock cost visibility without modifying application code.
Immediate next steps:
- Enable IAM principal–based cost allocation at the management account level in the AWS Billing console.
- Tag IAM users and roles with cost-relevant keys (e.g.,
team,cost-center,application), then activate those tags as IAM principal cost allocation tags. - Create a new CUR 2.0 export with “Include caller identity (IAM principal)” selected; existing exports are not retroactive.
Tags take up to 24 hours to appear in Cost Explorer after the tagged principal makes its first Bedrock API call. Enabling caller identity increases CUR export file size, so plan S3 lifecycle policies before you flip the switch.
Key Takeaways
IAM principal–based cost allocation is the lowest-effort path to per-user and per-role Bedrock cost visibility, but real-time metering is required for per-prompt accounting and live budget enforcement.
| Point | Details |
|---|---|
| Enable IAM principal attribution first | No code changes needed; activate in Billing console and create a new CUR 2.0 export with caller identity. |
| Tags are not retroactive | Tag principals before they call Bedrock; activation takes up to 24 hours after the first call. |
| Handle gateways with session tags | Pass session tags via STS AssumeRole to preserve per-user or per-tenant attribution through shared roles. |
| CUR file size will grow | Enabling caller identity increases row counts; apply S3 lifecycle policies before rollout. |
| P402 for real-time accountability | P402 meters each Bedrock call as a live economic event, filling the 24–48 hour CUR latency gap with per-request attribution and audit evidence. |
Table of Contents
- How Bedrock cost attribution works and what mechanisms are available
- How to choose the right attribution approach for your business goal
- Setting up IAM principal–based cost allocation for Amazon Bedrock
- How to view and analyze Bedrock spend in AWS Cost Explorer and CUR 2.0
- How to maintain cost visibility when you use an LLM gateway or shared proxy
- Operational best practices, common pitfalls, and how to troubleshoot them
- Real-time metering and metadata-only approaches that complement Bedrock native telemetry
- Why real-time attribution changes the Bedrock cost accountability picture
- P402 closes the gap between Bedrock billing data and real-time cost accountability
- Sources
How Bedrock cost attribution works and what mechanisms are available
Granular cost attribution for Amazon Bedrock flows through four distinct mechanisms, each suited to a different attribution goal. Understanding the tradeoffs before you configure anything saves significant rework.
IAM principal attribution is automatic. Bedrock captures the caller identity on every inference request and writes it to the line_item_iam_principal column in CUR 2.0. No API changes required. Tags attached to the principal and activated in Billing aggregate costs across models in Cost Explorer. This mechanism applies to all Bedrock inference endpoints.
Projects attribute costs at the workload or application level for the Bedrock Responses and Chat Completions endpoints on the bedrock-mantle endpoint. Tags on a project flow to Cost Explorer and CUR 2.0, but Projects deliver aggregated billed dollars, not per-request costs. They scale better than profiles when many teams share the same models.
Application Inference Profiles replace model IDs with profile ARNs on bedrock-runtime endpoints and carry cost allocation tags to billing. They are model-specific, which means profiles can proliferate as models and teams scale. AWS recommends Projects for flexibility at scale and profiles for per-model control.
Per-request metadata (invocation logs + CloudWatch) provides the finest granularity: token counts and latency per call. It requires enabling model invocation logging and building your own aggregation layer.
| Mechanism | Best for | Granularity | Implementation complexity | Data latency | Privacy implications |
|---|---|---|---|---|---|
| IAM principal attribution | Per-user, per-role chargeback | Aggregated per principal per day | Low — no code changes | 24–48 hours in CUR | IAM identity visible in billing data |
| Projects | Per-application, per-workload | Aggregated billed dollars | Low — create project, assign endpoint | 24–48 hours in CUR | Project tag visible in billing |
| Application Inference Profiles | Per-model, per-application | Aggregated per profile per day | Medium — replace model IDs with ARNs | 24–48 hours in CUR | Profile ARN visible in billing |
| Per-request metadata (invocation logs) | Per-prompt token accounting | Per-call tokens and latency | High — logging pipeline required | Near-real-time in CloudWatch | Prompt/response stored in logs |
The key limitation across all native mechanisms: billing data is aggregated at the day level. None of them give you a per-request dollar figure directly from CUR.
How to choose the right attribution approach for your business goal
The right method depends on what you need to do with the cost data, not on what is technically possible.
Decision criteria to evaluate first:
- Do you need chargeback invoices for internal teams or external tenants?
- Is per-prompt token cost required, or is daily aggregation sufficient?
- Do API calls route through a shared gateway or proxy role?
- What engineering effort is available for instrumentation?
- Are there data privacy constraints that prevent storing request metadata?
Recommended approach by goal:
| Business goal | Recommended approach | What you gain | What you must change |
|---|---|---|---|
| Internal team chargeback | IAM principal tags or Projects | Cost by team in Cost Explorer, no code changes | Tag principals, activate tags, new CUR export |
| Per-tenant SaaS billing | Session tags via STS + gateway role | Per-tenant cost rows in CUR | Gateway must pass session tags on AssumeRole |
| Per-prompt token billing | Invocation logs + per-request metadata | Token counts per call | Enable model invocation logging, build aggregation |
| Model cost comparison | Application Inference Profiles | Cost by model/profile in billing | Replace model IDs with profile ARNs |
| Workload-level attribution at scale | Projects | Aggregated cost by workload, no profile proliferation | Create projects, assign to endpoints |
Combining methods is valid and often necessary. A typical enterprise setup uses IAM principal attribution for team-level chargeback, Projects for workload segmentation, and invocation logs for anomaly investigation. The IAM principal attribution docs confirm that tags and principal identity are complementary, not mutually exclusive.
Setting up IAM principal–based cost allocation for Amazon Bedrock
This walkthrough follows the AWS Cloud Financial Management announcement of the feature and the Bedrock user guide steps.
Prerequisites:
- Management account access with permissions to the AWS Billing console.
- An S3 bucket designated as the CUR 2.0 export destination.
- A tag governance policy defining key names before you activate tags.
- Awareness of any gateway or shared-role architecture in your environment.
Setup steps:
- Tag IAM users and roles. Add cost-relevant tags directly to each principal. Recommended keys:
team,cost-center,application,environment. Example:team=platform-ai,cost-center=cc-1042. - Activate tags as IAM principal cost allocation tags. In the AWS Billing console, navigate to Cost Allocation Tags, filter for IAM principal tags, and activate each key. Tags only appear after the tagged principal makes at least one Bedrock API call.
- Enable IAM principal–based cost allocation. In the Billing console under Cost Management settings, enable “IAM principal–based cost allocation for Amazon Bedrock.”
- Create a new CUR 2.0 export. In the AWS Billing and Cost Management console, create a new export. Select “Include resource IDs” and check “Include caller identity (IAM principal).” Point the export to your S3 bucket. Do not modify an existing export; the feature is not retroactive.
- Wait 24–48 hours. Tags and principal data populate after the first billing period cycle following activation.
- Verify in Cost Explorer. Filter by Service = Amazon Bedrock, then group by “IAM principal” or by your activated tag key. Confirm principal ARNs appear in the dimension drop-down.
- Validate in CUR 2.0 via Athena. Query the
line_item_iam_principalcolumn to confirm data is flowing.
Sample Athena query to validate principal data:
SELECT
  line_item_iam_principal,
  SUM(line_item_unblended_cost) AS total_cost,
  SUM(line_item_usage_amount) AS total_usage
FROM your_cur_database.your_cur_table
WHERE product_service_name = 'Amazon Bedrock'
  AND line_item_usage_start_date >= DATE '2026-01-01'
GROUP BY line_item_iam_principal
ORDER BY total_cost DESC;
Pro Tip: If CUR export file sizes grow faster than expected, apply an S3 Intelligent-Tiering lifecycle policy to the export prefix. Enabling caller identity multiplies row counts when many distinct principals call Bedrock, so storage costs can increase meaningfully at scale.
How to view and analyze Bedrock spend in AWS Cost Explorer and CUR 2.0
Cost Explorer and CUR 2.0 serve different purposes. Cost Explorer is for fast visual analysis and alerting. CUR 2.0 via Athena is for precise, queryable line-item data.
Cost Explorer filters and groupings for Bedrock:
- Service filter: Amazon Bedrock (isolates all Bedrock charges).
- Group by: IAM principal, or by an activated tag key such as
teamorcost-center. - Usage type filter: Use
line_item_usage_typeto split input tokens (InputTokens), output tokens (OutputTokens), and on-demand inference charges by model. - Saved reports: Create a saved Cost Explorer report for “Bedrock by IAM Principal” and schedule a weekly email to finance stakeholders.
- Anomaly detection: Enable AWS Cost Anomaly Detection on the Amazon Bedrock service monitor. Set a threshold (e.g., $50 absolute or 20% relative) to receive alerts before a runaway job inflates the monthly bill.
Recommended CUR 2.0 Athena queries:
Cost by IAM principal and model:
SELECT
  line_item_iam_principal,
  line_item_resource_id AS model_id,
  SUM(line_item_unblended_cost) AS cost_usd
FROM your_cur_database.your_cur_table
WHERE product_service_name = 'Amazon Bedrock'
GROUP BY 1, 2
ORDER BY cost_usd DESC;
Cost by token direction (input vs. output):
SELECT
  line_item_usage_type,
  SUM(line_item_unblended_cost) AS cost_usd,
  SUM(line_item_usage_amount) AS token_count
FROM your_cur_database.your_cur_table
WHERE product_service_name = 'Amazon Bedrock'
GROUP BY line_item_usage_type
ORDER BY cost_usd DESC;
Dashboard templates to build:
| Dashboard | Key columns | Refresh cadence | Primary audience |
|---|---|---|---|
| Monthly chargeback by team | line_item_iam_principal, activated tag, cost |
Monthly | Finance, team leads |
| Top N principals by spend | line_item_iam_principal, cost rank |
Weekly | Platform engineering |
| Model cost comparison | line_item_resource_id, usage type, cost |
Weekly | AI/ML leads |
| Anomalous spend alerts | Cost delta vs. prior period | Daily | FinOps, on-call |
CUR data typically lags 24–48 hours. For near-real-time signal, combine CUR with CloudWatch model invocation logs, which capture token counts per request within minutes of the call. The multi-tenant tracking practitioner guide covers CloudWatch-based patterns for environments where CUR latency is insufficient.
How to maintain cost visibility when you use an LLM gateway or shared proxy
The core problem with gateway architectures: the gateway’s execution role becomes the caller in CUR 2.0 and Cost Explorer. Every Bedrock call appears under one IAM principal, collapsing per-user or per-tenant attribution into a single line.
Options to restore visibility:
- Session tags via STS AssumeRole. The gateway calls
sts:AssumeRolewith session tags (e.g.,tenant-id,user-id) before calling Bedrock. Those session tags override the role’s static tags for that session and appear in CUR 2.0. This is the recommended approach for multi-tenant SaaS. - Distinct RoleSessionName per user or tenant. Pass a unique
RoleSessionName(e.g.,tenant-acme-session-42) on each AssumeRole call. The session name appears in CloudTrail and can be correlated with CUR data, though it does not create a separate CUR row by itself. - Per-request metadata forwarded to a metering platform. Emit a lightweight event at request time (principal, model, token estimate, timestamp) to an external metering system. This decouples attribution from CUR latency entirely.
Implementation checklist for session tag–based attribution:
- Grant the gateway’s execution role
sts:TagSessionpermission in its IAM policy. - Configure the identity provider (IdP) to pass user or tenant attributes as session tag claims.
- Update the gateway’s AssumeRole call to include
Tags: [{Key: "tenant-id", Value: "<tenant>"}]. - Activate
tenant-idas a cost allocation tag in the Billing console. - Implement a session token cache (e.g., 15-minute TTL) to avoid excessive STS calls.
- Verify in CloudTrail that
AssumeRoleevents carry the expected session tags.
Pro Tip: For multi-tenant SaaS, combine session tags with a unique RoleSessionName. Session tags drive CUR attribution; the session name provides a CloudTrail audit trail that maps individual requests to tenants without storing prompt content.
If per-user session tags are not feasible (e.g., a legacy gateway with no IdP integration), tag the gateway execution role at the team or application level and use Application Inference Profiles to add model-level segmentation. That combination gives partial attribution without gateway code changes.
Operational best practices, common pitfalls, and how to troubleshoot them
Best practices:
- Define tag key names centrally before activating. Inconsistent casing (
Teamvs.team) creates duplicate tag dimensions in Cost Explorer. - Tag at the team or cost-center level, not at the individual API key level. Per-key tagging creates hundreds of principals and inflates CUR file size without proportional insight.
- Activate tags only after tagging the principals. Activating a tag key before any principal carries it produces an empty dimension in Cost Explorer.
- Schedule CUR exports to an S3 prefix with a lifecycle rule. Apply Intelligent-Tiering or Glacier transition after 90 days. Enabling caller identity can meaningfully increase row counts when many distinct principals are active.
- Use AWS CloudTrail alongside CUR. CloudTrail records every
InvokeModelcall with the full principal ARN and request parameters, providing the audit trail that CUR’s aggregated billing data cannot.
Common pitfalls and fixes:
- Tags missing from Cost Explorer. The principal has not made a Bedrock call since tagging. Run a test
InvokeModelcall from the tagged principal, then wait up to 24 hours. - Existing CUR export shows no
line_item_iam_principalcolumn. The feature is not retroactive. Create a new CUR 2.0 export with caller identity enabled; the old export will not gain the column. - CUR file size growing faster than expected. Each distinct principal that calls Bedrock generates additional rows. Apply S3 lifecycle policies and consider filtering CUR queries to the
Amazon Bedrockservice to reduce Athena scan costs. - Gateway attribution collapsed to one role. Implement session tags via STS as described in the gateway section above.
- Tag dimension shows
No tag keyfor some rows. Some principals were not tagged before calling Bedrock. Tag them now and activate; historical rows will not backfill.
Troubleshooting sequence:
- Run a test
InvokeModelcall from a tagged IAM user or role. - Check the Cost Explorer Tag drop-down for the activated key after 24 hours.
- Query
line_item_iam_principalin Athena to confirm non-null values. - If the column is absent, verify the CUR export was created after enabling caller identity.
- If session tags are missing, check CloudTrail for
AssumeRoleevents and confirmsts:TagSessionis permitted.
Pro Tip: Combine CUR attribution with a per-request metadata layer or a metering platform when per-prompt token cost accuracy matters for billing or compliance. CUR gives you daily aggregates; per-request metadata gives you the line-item precision that chargeback and audit workflows require.
Real-time metering and metadata-only approaches that complement Bedrock native telemetry
Bedrock’s native attribution is post-facto and aggregated. CUR data arrives 24–48 hours after the event, and the smallest unit of cost is a day-level aggregate per principal per usage type. For organizations that need immediate budget enforcement, per-prompt billing, or audit-grade evidence, a real-time metering layer fills that gap.
Native attribution vs. real-time metering:
| Dimension | Bedrock native (CUR 2.0) | Real-time metering (metadata-only) |
|---|---|---|
| Attribution timing | 24–48 hour lag | Sub-second at request time |
| Granularity | Day-level aggregate | Per-request event |
| Prompt storage | None | None (metadata-only mode) |
| Budget enforcement | Retroactive alerts | Live policy enforcement |
| Audit evidence | Billing line items | Immutable event log per request |
| Implementation effort | Low (CUR + tags) | Medium (SDK/API integration) |
Implementation pattern for metadata-only live metering:
- At request time, emit a minimal event: principal, model, estimated input tokens, timestamp, workflow ID. No prompt content stored.
- Receive the response and emit a completion event: output tokens, latency, cost estimate.
- Map events to CUR line items at reconciliation time using principal ARN and timestamp as join keys.
- Surface discrepancies between live event totals and CUR billed amounts; investigate outliers in CloudTrail.
Operational caveats:
- Live metering requires consistent request tagging. A request missing a workflow ID creates an unattributed event that cannot be reconciled later.
- Privacy modes matter. Metadata-only tracking avoids prompt storage, but the event log itself (principal, model, token count) may be subject to data retention policies. Define retention periods before deployment.
- Live metering can trigger immediate budget actions (block, throttle, alert) that CUR-based alerting cannot. This is the primary operational advantage over native billing data.
Pro Tip: Use metadata-only live metering to generate billing events that match your invoicing cadence exactly. Emit a “billing period close” event at month-end to lock token counts and costs before CUR finalizes, eliminating the reconciliation cycle between engineering and finance.
Why real-time attribution changes the Bedrock cost accountability picture
The gap between what Bedrock native billing provides and what finance teams actually need is wider than most AWS users expect when they first enable the feature. CUR 2.0 with IAM principal attribution is a genuine improvement: it eliminates the “black box” problem where all Bedrock spend appeared under a single service line. But aggregated daily rows are not the same as per-request accountability.
The organizations that get the most from Bedrock cost tracking tend to combine two layers. The first is the native CUR layer for billing reconciliation, chargeback reports, and Cost Explorer dashboards. The second is a live metering layer that captures each request as an economic event at the moment it occurs, with metadata that maps directly to business entities: the tenant, the workflow, the product feature. That second layer is where budget enforcement becomes possible in real time, and where audit evidence becomes credible rather than reconstructed from aggregates.
Platforms like P402 exist precisely because the native layer, while necessary, is not sufficient for organizations with strict cost-of-goods accounting or multi-tenant billing obligations. The AI token usage dashboard and AI COGS dashboard P402 provides are designed to sit alongside CUR data, not replace it. The reconciliation between live events and CUR line items is where the real operational value appears: discrepancies surface billing errors, untagged principals, and gateway attribution gaps before they become month-end surprises.
P402 closes the gap between Bedrock billing data and real-time cost accountability
Native Bedrock attribution tells you what was spent. P402 tells you what is being spent, by whom, on which workflow, right now.
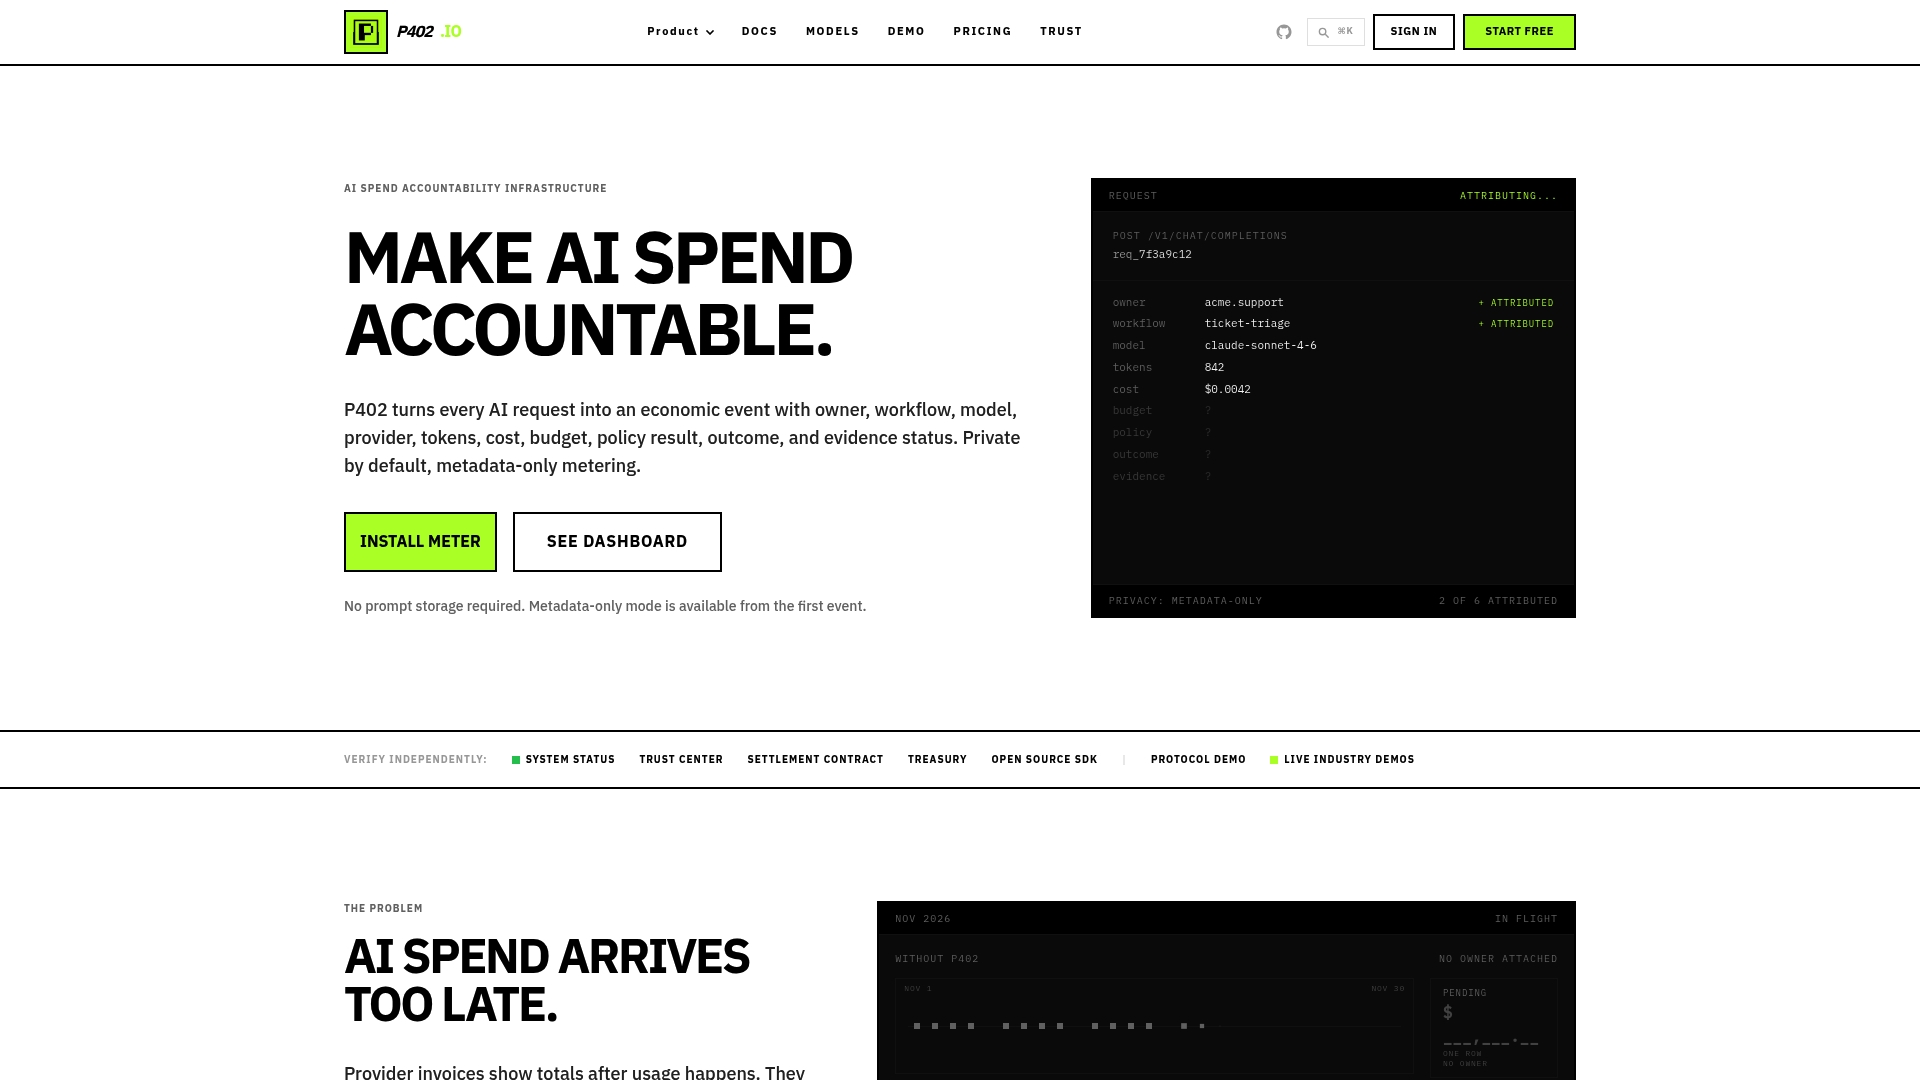
P402 meters every Bedrock API call as an immutable economic event: principal, model, input tokens, output tokens, cost, workflow, and policy result, captured at request time with no prompt storage. That event stream reconciles directly against CUR 2.0 line items, so finance teams get both the real-time signal and the billing-grade audit trail. For multi-tenant SaaS teams, P402 handles per-tenant attribution without requiring gateway refactoring. For enterprise finance leaders, the AI spend audit engagement identifies untagged principals, gateway blind spots, and attribution gaps before they compound. For teams ready to move from reactive billing review to live budget enforcement, P402 pricing starts with usage-based metering tiers scaled to event volume.
Sources
Official AWS documentation and blog posts to consult during setup:
- Introducing granular cost attribution for Amazon Bedrock | Artificial Intelligence
- Projects
- Tracking Amazon Bedrock usage and costs per tenant in a multi‑tenant environment with application inference profiles